
In the dynamic realm of manufacturing, identifying and implementing effective growth strategies is a complex task. Understanding your company's performance in comparison to others in the manufacturing sector is crucial for strategic planning and improvement.
To assist manufacturing companies in this endeavor, we've partnered with Databox to establish a Growth Metrics Benchmark Group specifically for High-Achieving Manufacturing Companies. This ongoing benchmark study provides anonymous, real-time data comparisons on key metrics such as deal closure times, lead generation, customer acquisition, and more.
When we say High-Achieving, we mean companies with an Annual Recurring Revenue (ARR) ranging from $10M to $250M and targeting ambitious revenue growth goals of 15% or more in the upcoming year.
With data from 290+ companies and growing, you can get detailed insights into how your company is performing across the board. With just a glance at the available benchmark data, you can quickly discover which sales and marking metrics your business is excelling in and where there is room for improvement.
Members of the group can even track their performance vs. the benchmark over time, making it easy to see progress or the lack thereof. The best part?
- It's 100% anonymous and
- It is 100% free
This means that you can compare your data to similar companies within your industry without worrying about anyone sharing it.
Before we share some of the data we compiled, here is how to read the benchmark charts.
How to Read the Benchmark Charts
In our High-Achieving Manufacturing Companies Benchmark Group, you will see charts similar to the one below. If you are comfortable with statistical analysis, reading these will be a breeze. On the other hand, if this is new to you, it can be confusing, but that is why you can go through this helpful guide and learn how to do it.
This chart shows a fictitious company’s performance against a sample of companies.
The blue vertical line represents a company’s performance in the previous month. For this company, it shows 2,400 Page views. The chart also shows the following:
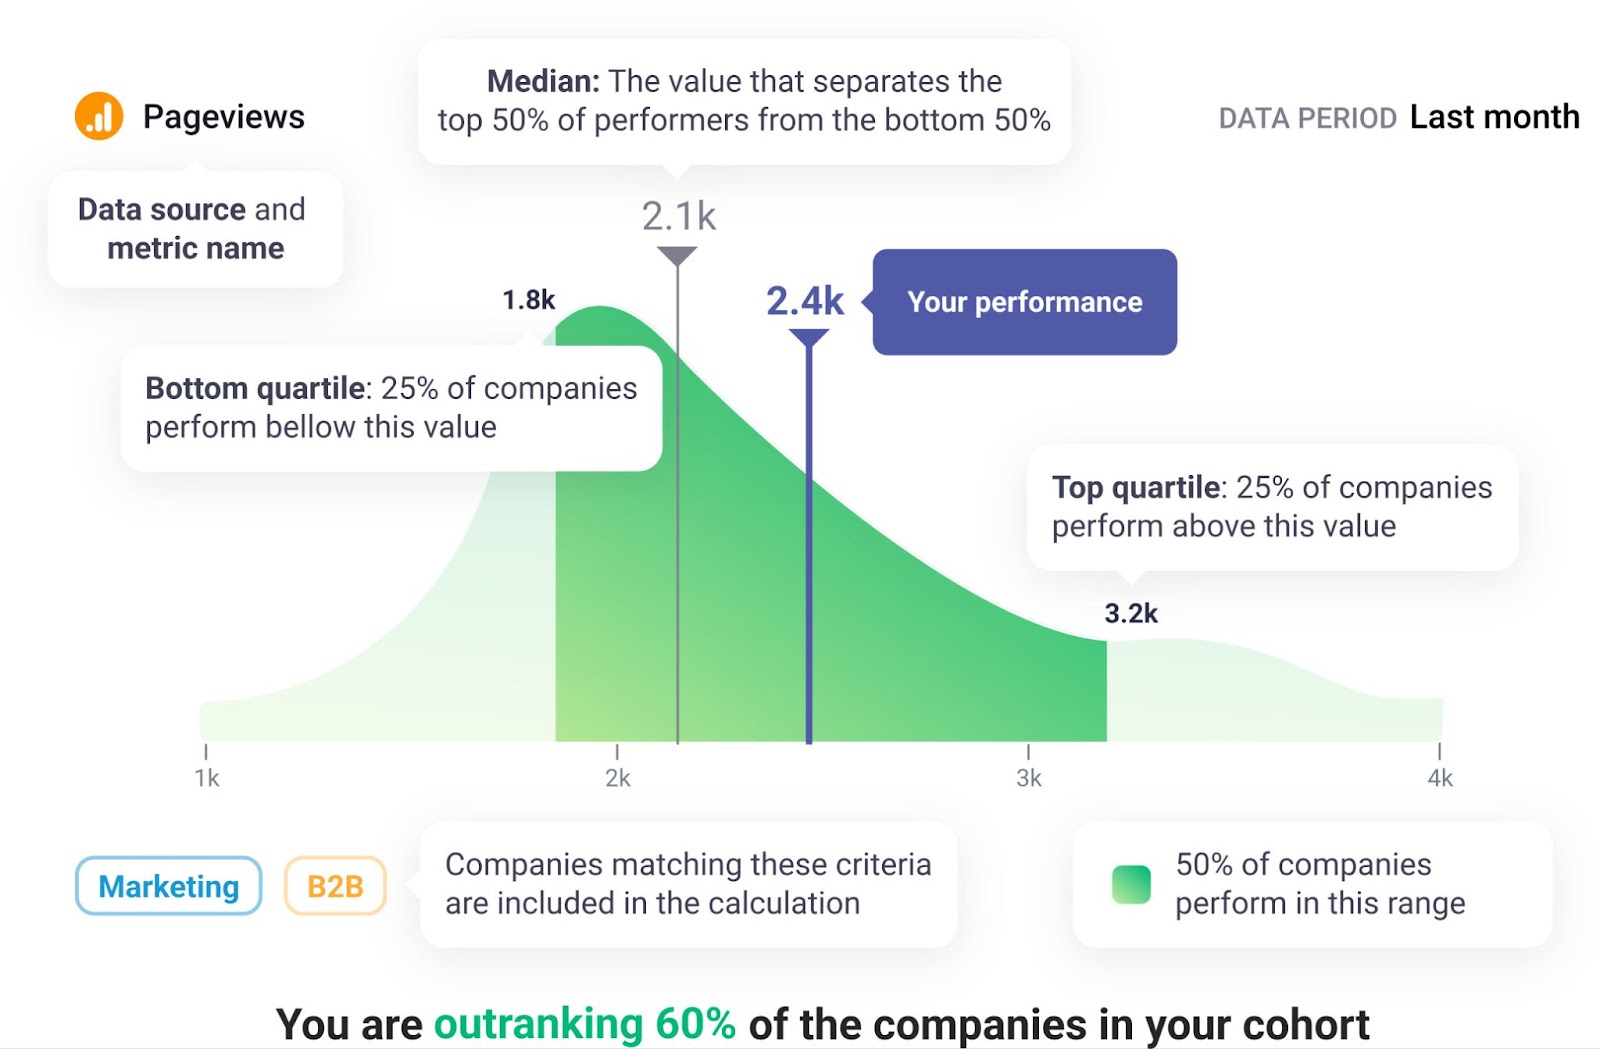
- The bottom 25% of performers for this metric had below 1,800 Page views.
- The top 25% of performers had above 3,200 Page views.
- The median value is 2,100 sessions, which means that 50% of companies had more than 2,100 sessions in the previous month, and 50% had less.
The height of the green chart shows the frequency at which someone had the value that’s shown on the horizontal or x-axis. For example, in this chart, a relatively large % of the population had Page views of around 2,000 last month, as that’s where the peak of the chart is.
You are all set to join the group and read your graphs. Now, let’s see some of the data from our group.
HubSpot Marketing Benchmarks for High-Achieving Manufacturing Companies
To get the insights we want within this group, we focus on data HubSpot CRM and HubSpot Marketing, as well as other sources. Let’s first start with metrics from HubSpot Marketing. The group shares data on a total of 10 metrics—3 from HubSpot Marketing and 7 from HubSpot CRM.
Here are the following 3 HubSpot Marketing metrics:
- New Leads - Total number of new contacts that have been added to your contacts database during a specified period.
- New Customers - Number of first-time customers acquired within a specified time frame.
- Blog Posts Published - Number of blog posts published within a certain time frame on a website.
Monitoring these metrics and comparing your data to the industry benchmarks can help shape your growth strategy and ensure you reach your goals.
So, let’s dive in!
According to our benchmark group of over 290 High-Achieving Manufacturing Companies, the median value for New Leads for November 2023 was 138, For new customers 8, and the median value for Blog Posts Published was 169.5.
Here’s a chart showing the distribution of New Leads within the group:
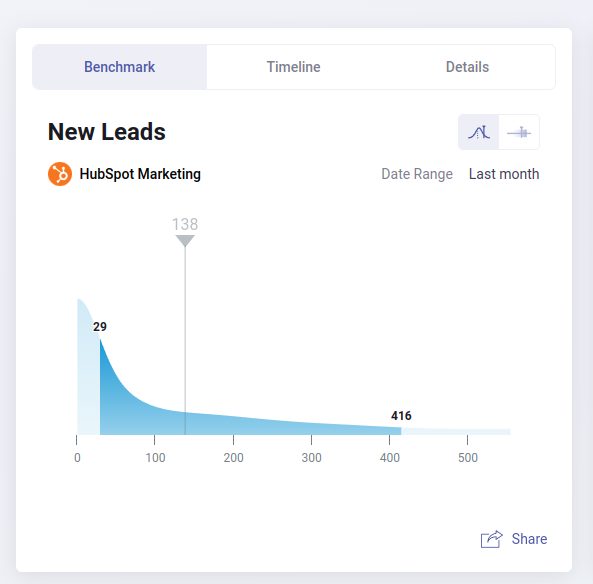
The height of the blue area shows the percentage of companies that have New Leads in that range. As you can see, the height of the chart on the left of the median as the number of New Leads approaches zero is very high. This means that lots of companies have a very low number of new leads in November 2023. In fact, 25% of the sample had between zero and 29, while 25% of the sample had between 29 and 138.
On the right side of the chart, you can see that 25% of the companies had between 138 and 416; it is very clear from this data that the range is wider in this case. We can also see that 25% of the sample had the number of New Leads higher than 416.
If your number of New Leads is higher than 138, you’re doing better than half the group. In order to increase the number of leads, you can use blogging as one of the possible channels.
As mentioned above, when you join the group, you’ll see charts like this. If it is green, you’re doing better than at least 50% of the sample. However, the charts you see can also be red if you are underperforming, meaning your number of New Leads is lower than 50% of the group.
Now, let’s learn more about the HubSpot CRM metrics we are tracking within the group.
HubSpot CRM for High-Achieving Manufacturing Companies
For HubSpot CRM, we are tracking the following seven metrics to get a better insight into our sales efforts.
- All Deals Amount - The sum of the total value of all open and closed deals in your sales pipeline.
- Average Time to Close Deal - The average duration it takes to close a deal, from initial contact to contract signing.
- Calls - Number of phone calls made between contacts and users in your account
- Companies - Total number of companies in your database
- New Deals Created Amount - Total revenue generated from newly created deals in a given period of time.
- Deals Closed Won - Total number of sales deals that have been successfully closed and won within a given time period
- Deals Closed Lost - Number of deals that have been fully progressed through the sales cycle but ultimately did not result in a sale or were lost to a competitor.
According to our benchmark group of over 290 High-Achieving Manufacturing Companies, the median value for All Deals amount for November 2023 was $1,695,723.75, and for Average Time to Close Deal, it was 72d 2h 46m. When it comes to Calls, the median value was 318, while for Companies, it was 71.5. Finally, for New Deals Created amount, the median value was $962,906.07, and we just have left the median values for Deals Closed Won - 17 and Deals Closed Lost - 20.
In this post, we will take a more detailed look into the Deals Closed Lost metric. In this case, we can see that the chart is inverted. As a general rule, we want to have fewer lost deals.
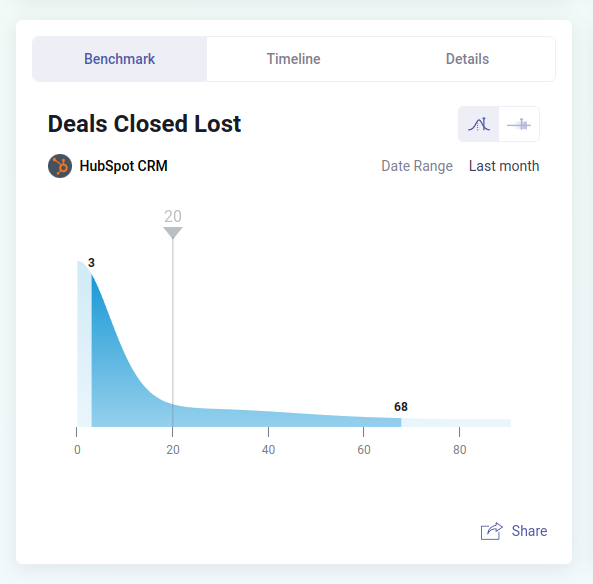
We can see that most companies fall between zero and 20, with 25% being between zero and 3, and 25% being between 3 and the median, which in this case is 20. Now, we would all like to be within the first 25%. Preferably to have zero Deals Closed Lost.
On the right side of the median, we see that 25% of companies have between 20 and 68, and the final 25% is over 68. In their case, the chart would be well in the red.
Please keep in mind that your stats will vary depending on your marketing and sales efforts. But don’t get discouraged; dive into the insights and make the necessary changes to hit your goals.
See how you measure by joining the group and connecting your HubSpot Marketing and HubSpot CRM.
Get More Industry Insights
If you want to know how well your growth strategy is performing and what you can do to improve it, take part in our Which Inbound and Outbound Marketing Solutions are Most Effective for B2B Growth survey. You will gain insights into key marketing tactics and channels driving B2B's business growth.
Here are some interesting insights from B2B companies that participated thus far. For example, for most companies, outbound marketing has been most effective in generating leads and conversions.
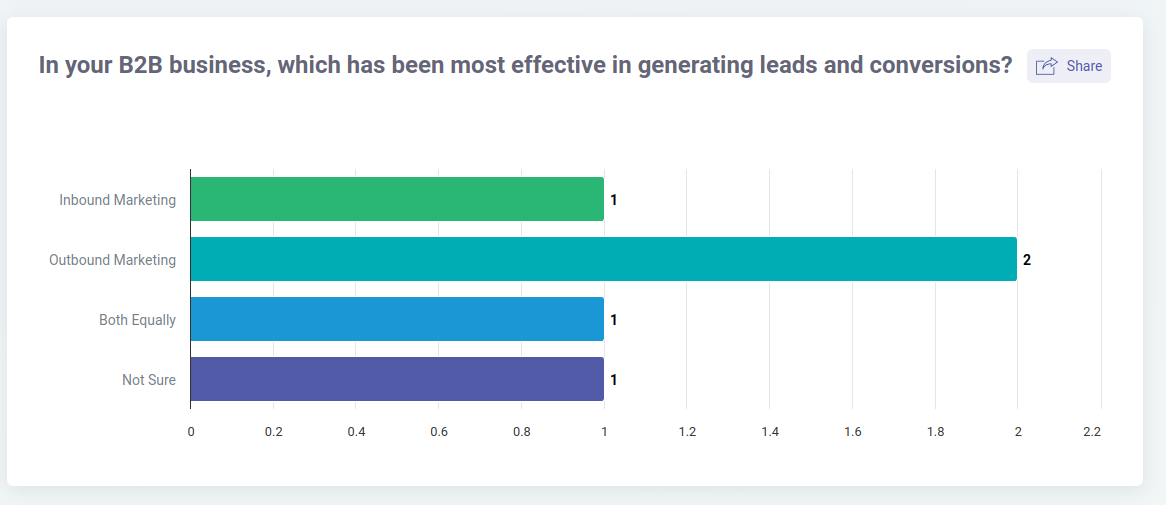
Which channel has been the most effective for your company?
The survey is still open, and we invite you to take it. That way, you will be among the first to get your hands on all the interesting insights it reveals.
You can take the survey here!
Recent posts